8-Bit Baseball Cards (Dodgers)
Player stats determine visual quality — from NES pixels to gold-foil cards.
The problem
Baseball stats are usually presented in tables. I wanted a way to see performance at a glance — where the visual itself tells you how good a player is, without reading a single number.
The approach
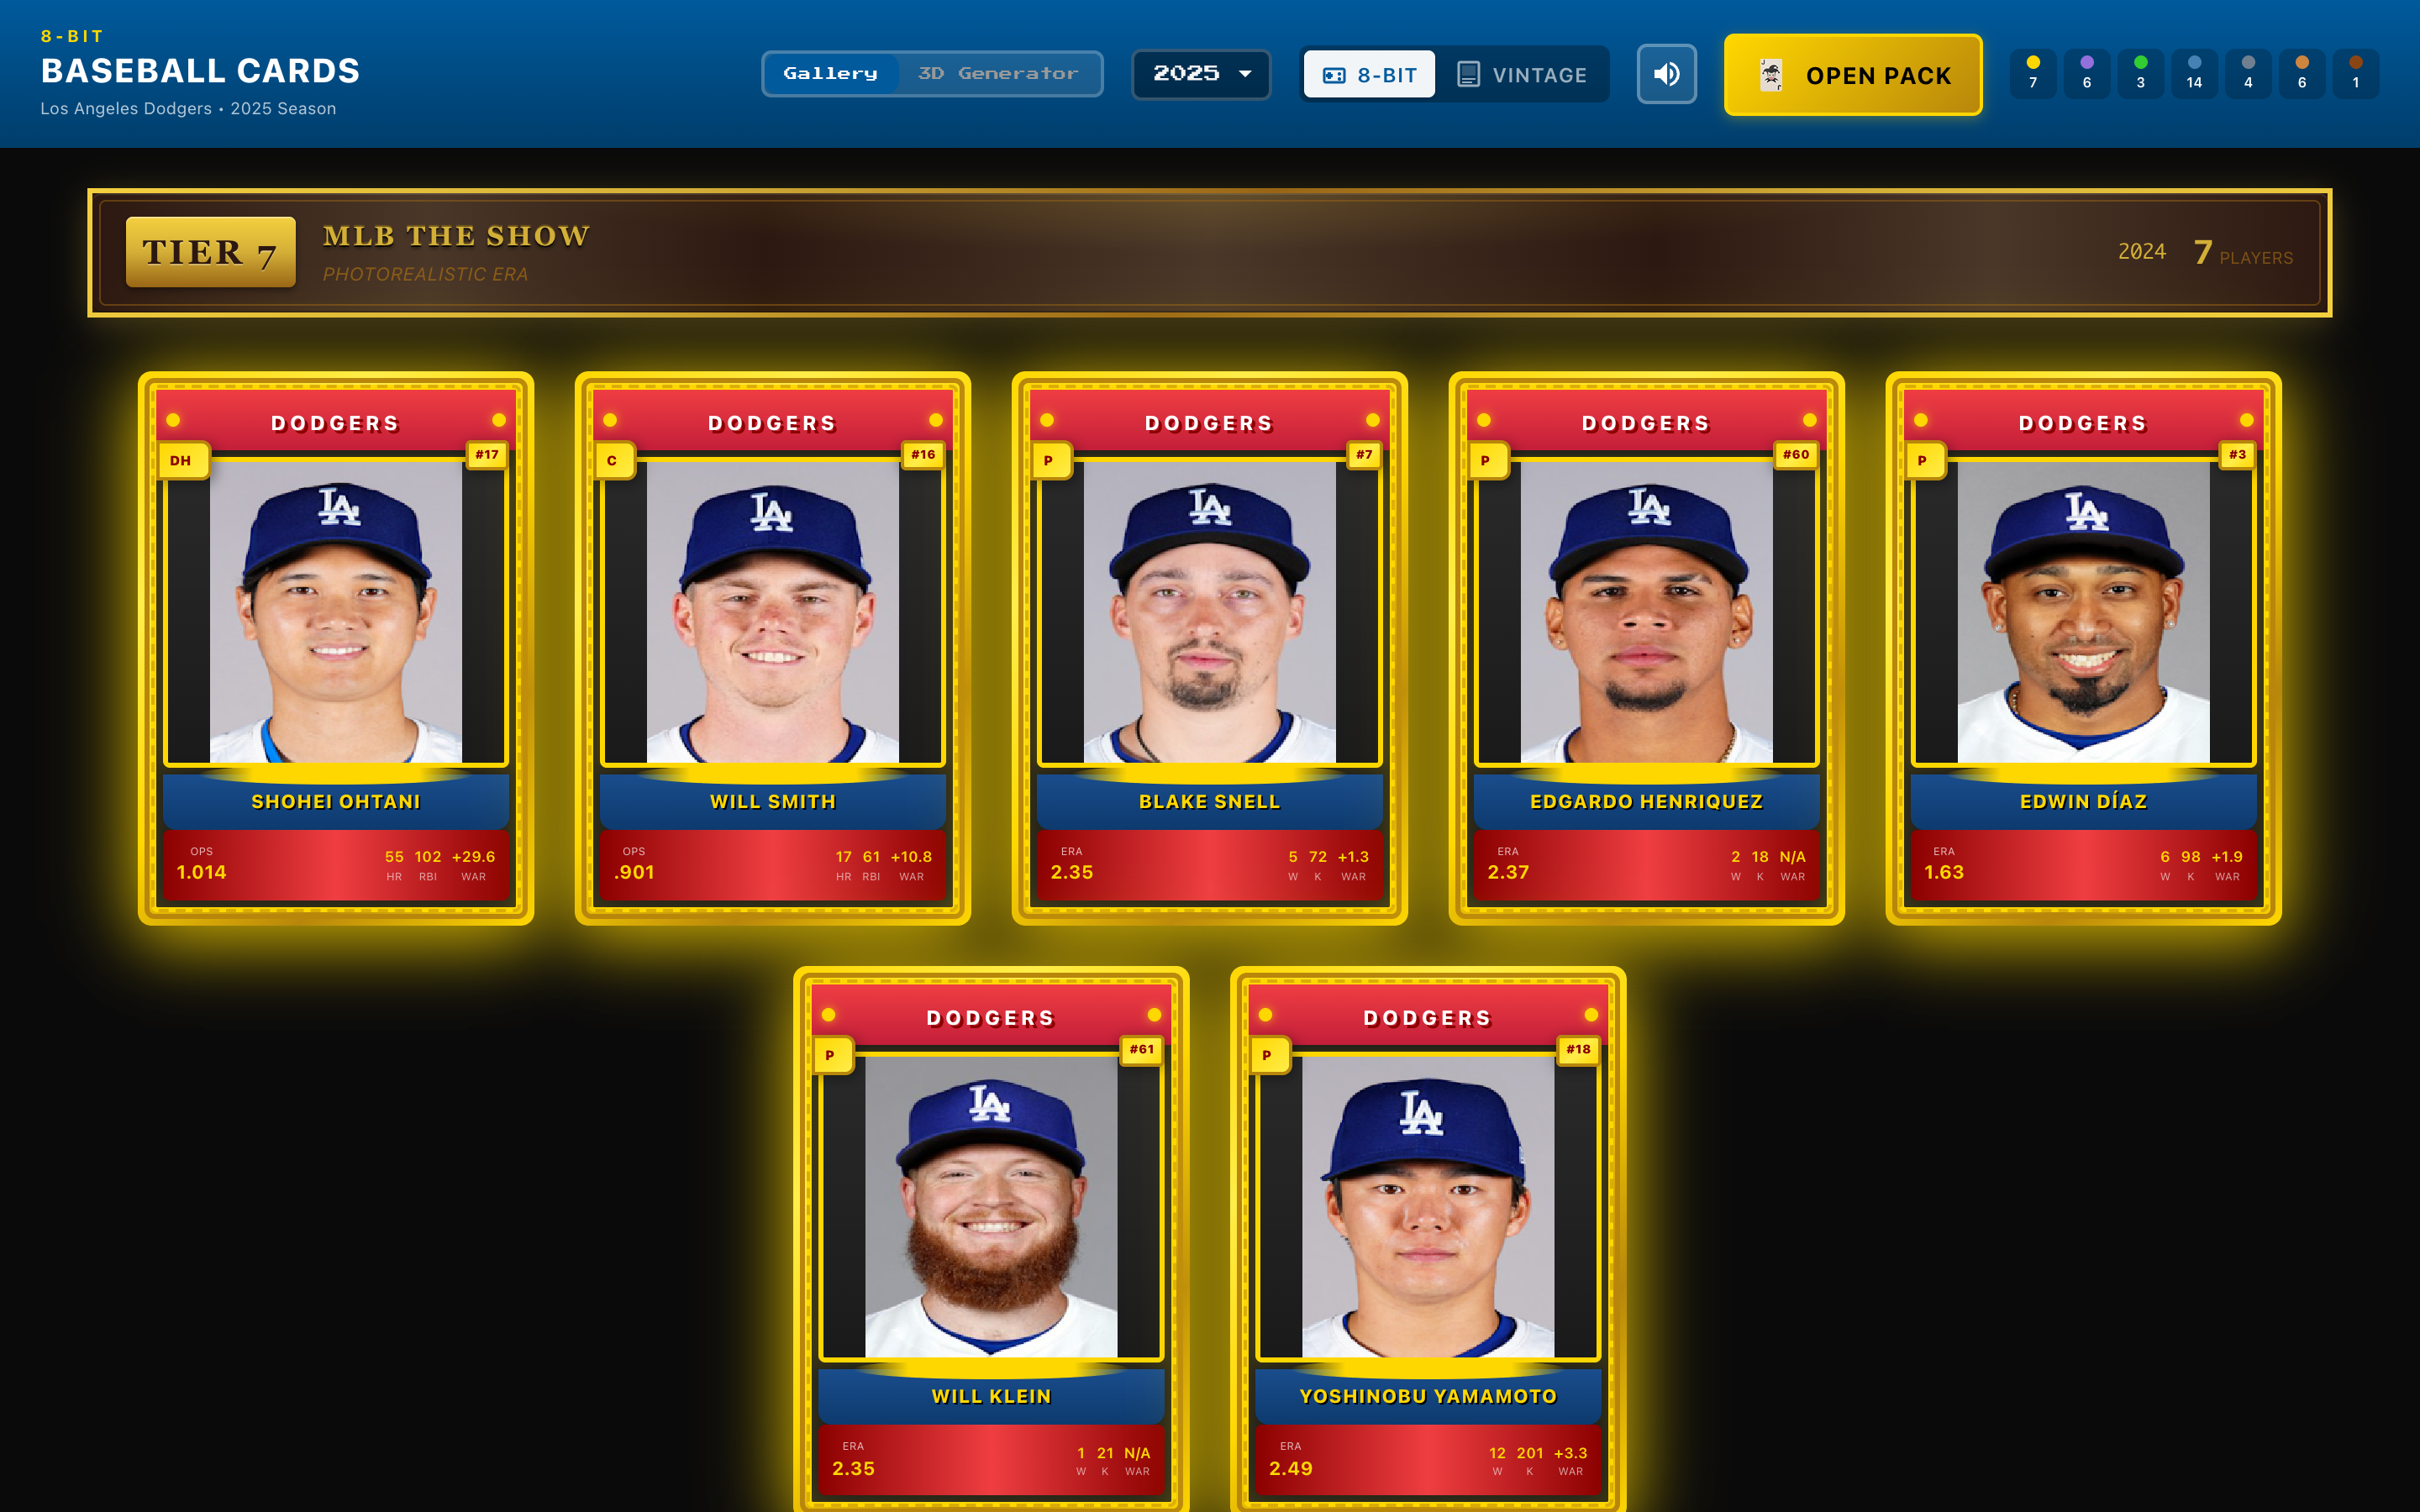
A 7-tier system maps player performance to video game eras. A struggling pitcher gets chunky NES-era 4-color pixels with CRT scanlines. An MVP candidate gets crisp MLB The Show rendering with 256 colors and gold-foil framing. Your eye immediately knows who’s elite.
Each card also has a 3D mode — Three.js generates voxel-style player models at runtime with progressive detail matching the tier. Cards flip to reveal detailed stats and a breakdown of why the player earned their tier.

How it works
React 19 renders the card gallery. Real-time stats from the MLB Stats API determine each player’s OPS or ERA tier. A custom canvas pipeline handles the pixelation — median-cut color quantization and Floyd-Steinberg dithering produce authentic retro sprites. Three.js procedural models are generated at runtime with no pre-built assets.